
Transaction Dossier
BASF Coatings / Surventis: A Public-Information Transaction Reconstruction
A German industrial carve-out viewed through operating diligence, valuation, leveraged financing, downside credit, and source-level review controls.
This is an independent, public-source reconstruction of Carlyle and Qatar Investment Authority's acquisition of BASF's automotive OEM coatings, automotive refinish, and surface-treatment businesses. EOJI was not retained by any transaction party and had no access to confidential diligence, a quality-of-earnings report, a credit agreement, or a closing funds-flow statement.
EOJI analytical conclusion — not a transaction fact. Plausible only under substantial earnings normalization. The technical and commercial platform appears credible, but the transaction is not supported by FY2025 actual earnings on a conventional buyout basis.
Executive View
The transaction closed on 30 June 2026 at a reported €7.7 billion enterprise value. BASF reported approximately €5.8 billion of pre-tax cash proceeds, retained 40% of the standalone business now called Surventis, and left Carlyle and QIA with 60% controlling ownership. Those headline terms are directly supported by BASF's closing announcement and BASF's 2026 half-year report.
The analytical boundary is equally important. The exact sponsor capitalization, closing cash, debt-like items, revolving credit facility, covenants, hedges, transaction expenses, working-capital adjustment, tax structure, management equity, and composition of lender pro forma EBITDA remain undisclosed. The sources-and-uses reconstruction below is therefore an analytical bridge, not the confidential funds flow.
| Question | Public answer | Evidence status |
|---|---|---|
| Asset or business | BASF's automotive OEM coatings, automotive refinish, and surface-treatment businesses, now operating as Surventis | Reported |
| Disclosed parties | BASF as seller and retained shareholder; Carlyle and QIA as controlling owners; Surventis as the standalone company | Reported |
| Structure | Carlyle and QIA control 60%; BASF retains 40% | Reported retention; Derived controlling complement |
| Publicly known economics | €7.7bn enterprise value; approximately €5.8bn pre-tax cash proceeds; approximately €1.3bn initial fair value for BASF's retained interest | Reported |
| Public earnings anchor | €3.746bn FY2025 sales and €544m FY2025 EBITDA before special items | Reported sales; Derived EBITDA |
| Secondary lender case | €880m lender PF adjusted EBITDA and approximately €4.51bn of identified acquisition financing | Secondary report; Derived financing total |
| Material terms still missing | Sponsor equity, RCF, covenants, hedges, QoE add-backs, closing adjustments, tax structure, governance and exit rights | Undisclosed |
| EOJI conclusion | Plausible only under substantial earnings normalization | EOJI analytical conclusion |
Evidence Status
The page keeps source authority and calculation status visible. Repetition in the press does not promote a secondary report to a primary fact.
| Label | Meaning on this page |
|---|---|
| Reported | Directly supported by a primary public filing, company announcement, regulator, audited report, or other authoritative source |
| Derived | Arithmetic or analytical output calculated from identified inputs shown on this page |
| Assumption | A selected scenario or model input; it is not asserted as a transaction term |
| Secondary report | Information attributed to a reputable secondary source but not verified in primary transaction disclosure |
| Undisclosed | A material term for which the approved source review found no authoritative public disclosure |
Transaction at a Glance
| Item | Value | Status | Source and qualification |
|---|---|---|---|
| Transaction close | 30 Jun 2026 | Reported | BASF closing announcement |
| Transaction enterprise value | €7.7bn | Reported | Enterprise value, not equity value or seller proceeds; BASF |
| Approximate pre-tax cash proceeds to BASF | €5.8bn | Reported | Rounded seller proceeds; BASF |
| BASF retained interest | 40% | Reported | Governance and exit terms remain undisclosed; BASF |
| Carlyle and QIA controlling interest | 60% | Derived | Complement of the reported 40% BASF interest |
| FY2025 sales | €3.746bn | Reported | Audited discontinued-operations disclosure; BASF Report 2025 |
| FY2025 EBITDA before special items | €544m | Derived | BASF group measure including Coatings less the measure excluding discontinued Coatings; steering concept |
| Final lender PF adjusted EBITDA | €880m | Secondary report | Lender-market syndication report; not audited, contractual, or QoE-verified; LCD/PitchBook report |
| Identified financing reconstruction | €4.508bn | Derived | Mix of official and secondary financing evidence; excludes any undisclosed RCF |
| Valuation date | 30 Jun 2026 | Assumption/control date | Used for market and FX alignment |
| Information cut-off | 31 Aug 2026 | Assumption/control date | Later information is not silently introduced |
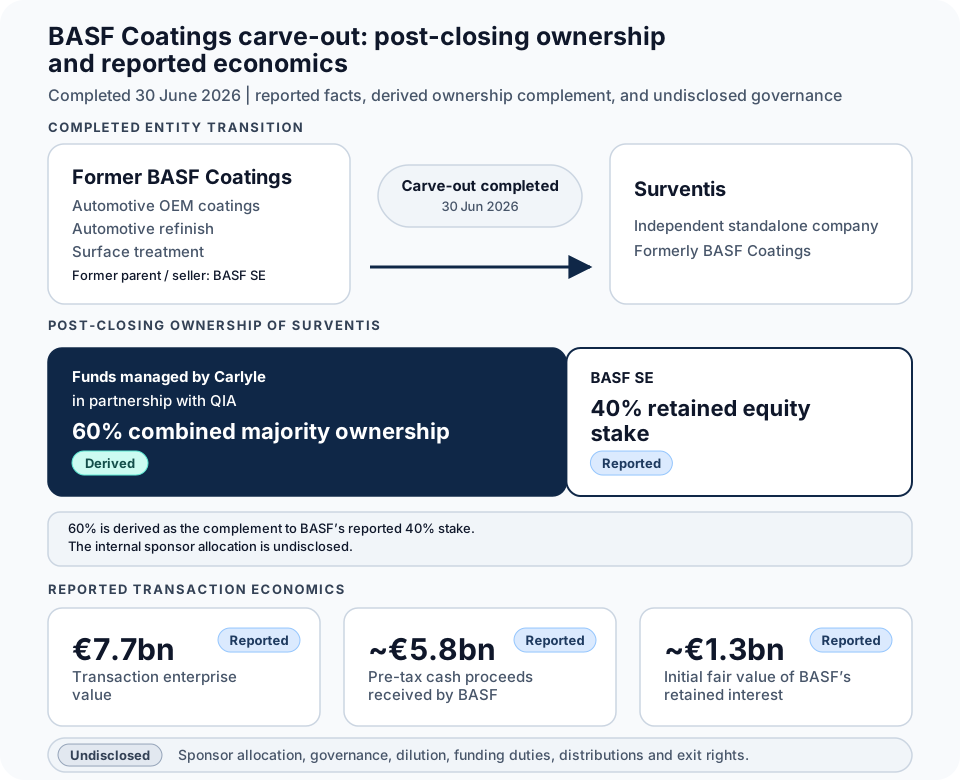
Post-closing ownership and reported economics. Surventis is the standalone business formerly known as BASF Coatings. BASF’s 40% retained equity stake, the €7.7bn transaction enterprise value, approximately €5.8bn of pre-tax cash proceeds received by BASF, and approximately €1.3bn initial fair value of the retained interest are Reported. The 60% combined sponsor ownership is Derived as the complement to BASF’s disclosed stake. The allocation between Carlyle-managed funds and QIA, along with governance, dilution, funding, distributions, and exit rights, is Undisclosed.
Disclosed Facts and Disclosure Boundary
The approved source review found a coherent public perimeter, but not a complete capitalization or QoE bridge.
| Topic | What is supported | What remains outside the public record | Status |
|---|---|---|---|
| Acquired perimeter | Automotive OEM coatings, automotive refinish, and surface treatment | Legal-entity allocation and closing adjustments | Reported / Undisclosed |
| Seller economics | €7.123bn accounting consideration, approximately €5.8bn pre-tax cash proceeds, and approximately €1.3bn retained-interest fair value | Exact cash/debt/working-capital bridge from EV to consideration | Reported / Undisclosed |
| Ownership | 60% Carlyle/QIA control and 40% BASF retained interest | Governance, dilution, funding, distributions and exit rights | Reported / Undisclosed |
| Historical earnings | FY2025 audited sales, EBIT, cash flow and balance-sheet items; €544m derived EBITDA before special items | Standalone carve-out costs and decision-grade normalization | Reported / Derived / Undisclosed |
| Lender earnings | €880m final lender PF adjusted EBITDA cited in syndication reporting | Add-back composition, recurrence, overlap, timing and QoE validation | Secondary report / Undisclosed |
| Debt | Five public tranches reconstructed at approximately €4.508bn | RCF, covenants, hedges, baskets, exact RMB terms and closing FX | Reported / Secondary report / Derived / Undisclosed |
| Sponsor case | Transparent scenario assumptions and reverse-LBO outputs | Actual sponsor capitalization, management equity, distributions and investment case | Assumption / Undisclosed |
| Operations | Public footprint, qualification mechanisms, customer relationships and capacity projects | Customer/platform economics, plant profitability, claims history and systems-separation readiness | Reported / Undisclosed |
Transaction Mechanics, Sources and Uses, and Seller Rollover
The approximately 13x disclosure in BASF's closing announcement applies to the €8.7 billion value of the whole former Coatings division, including the separately sold decorative-paints business. It does not automatically describe the €7.7 billion Carlyle/QIA perimeter. BASF disclosed the decorative-paints transaction at approximately €981 million in its official closing release.
| Perimeter and value reconciliation | €mm | Status |
|---|---|---|
| Whole former Coatings division value | 8,700 | Reported |
| Less: decorative-paints transaction | (981) | Reported |
| Derived non-decorative value | 7,719 | Derived |
| Reported Carlyle/QIA transaction EV | 7,700 | Reported |
| Residual from rounded figures | 19 | Derived |
The €19 million residual supports perimeter coherence; it does not prove the legal allocation.
| Seller-side accounting bridge | €mm | Status and control |
|---|---|---|
| Accounting consideration received | 7,123 | Reported |
| Approximate pre-tax cash proceeds | 5,800 | Reported |
| Initial fair value of retained 40% | 1,300 | Reported, rounded |
| Cash plus retained interest | 7,100 | Derived |
| Bridge to consideration | 23 | Derived residual; closing effects unresolved |
| Simplified analytical uses | €mm | Status | Simplified analytical sources | €mm | Status |
|---|---|---|---|---|---|
| Enterprise value | 7,700 | Reported | Identified debt | 4,508 | Derived from mixed evidence |
| Minimum cash proxy | 352 | Derived from secondary leverage data | BASF rollover | 1,300 | Reported, rounded |
| Transaction fees | 77 | Assumption: 1.0% of EV | Sponsor/QIA plug | 2,399 | Derived balancing item |
| Financing fees and OID | 78 | Assumption and Derived | |||
| Total uses | 8,207 | Derived | Total sources | 8,207 | Derived |
Undisclosed: The approximately €2.399 billion sponsor/QIA figure is a balancing item, not a disclosed equity cheque. The €352 million cash amount is a lender-derived proxy, not a contractual minimum cash requirement.
Lens 1 — Operating and Technical Diligence
Surventis combines long-lived qualification, full-layer OEM systems, refinish workflows, surface-treatment capabilities, and a broad production and technical network. Surventis's launch disclosure cites approximately €3.9 billion of current rounded annual sales, around 10,700 employees, more than 42,000 customers in over 140 countries, and more than 30 production and development sites. Those scale indicators do not reveal customer or plant economics.
The public record also identifies recent investment. BASF commissioned a high-runner OEM coatings plant in Münster after two and a half years of construction, while Caojing resin capacity increased from 8,000 to 18,800 tonnes per year. The increase is 135%, but neither the Münster release nor the Caojing release discloses utilization, yield, customer commitments, or recurring EBITDA benefit.
| Operating indicator | Public value | Status | Analytical boundary |
|---|---|---|---|
| Current rounded annual sales | ~€3.9bn | Reported | FY2025 audited €3.746bn remains the model anchor |
| Employees | ~10,700 | Reported | Does not establish productivity or cost |
| Customers | More than 42,000 | Reported | Does not establish concentration or profitability |
| Production and development sites | More than 30 | Reported | Does not establish qualified alternate capacity |
| Münster employees | ~2,500 | Reported | Official site profile |
| Münster share of stated workforce | 23.4% | Derived | Workforce proxy, not revenue or EBITDA concentration |
| Caojing resin capacity | 8,000 to 18,800 t/year | Reported | Nameplate capacity, not realized benefit |
| Caojing capacity increase | 135% | Derived | Utilization and completed ramp remain undisclosed |
Formal qualification and delivery mechanisms are visible. Surventis describes an eleventh consecutive Airbus SQIP accreditation and more than 1,500 aerospace approvals and conformances; BASF describes Xiaomi full-layer systems from e-coat through clearcoat. These sources support technical depth, not customer economics. See the Airbus SQIP release, aerospace profile, and Xiaomi release.
Operating conclusion: Credible technical depth and value-creation options, but not yet a validated operating plan. Public awards, capacity announcements, and digital capabilities cannot be converted into EBITDA without plant, contract, and cash-benefit evidence.
Lens 2 — Valuation and Sponsor Return Sensitivities
The transaction's apparent entry multiple changes radically with the earnings definition. The €544 million public-evidence anchor is Derived from primary BASF disclosures. The €712 million, €800 million, and €880 million cases come from secondary process or lender reporting and remain sensitivities.
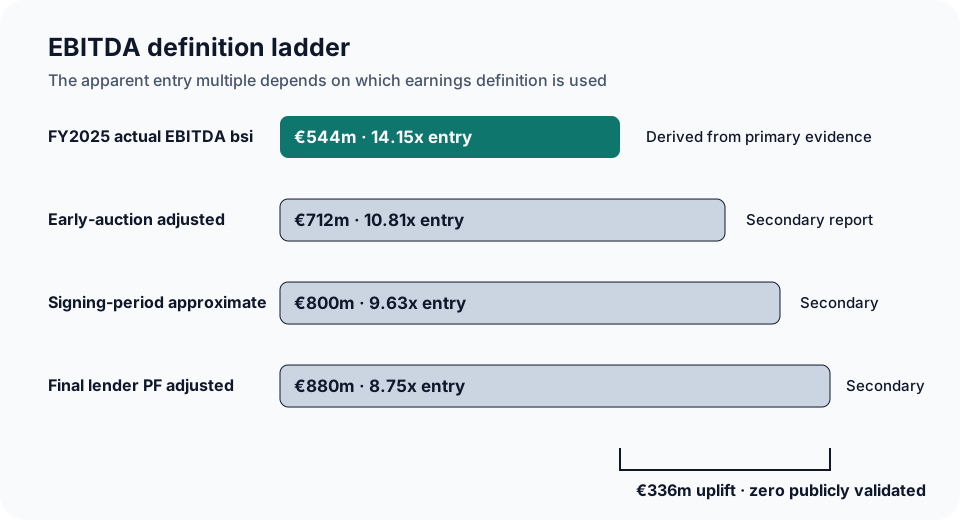
EBITDA-definition ladder. €544 million is Derived from primary evidence; €712 million, €800 million, and €880 million are Secondary report values. The chart does not validate the €336 million uplift from €544 million to €880 million.
| EBITDA definition | EBITDA | Margin on FY2025 sales | Entry EV / EBITDA | Status |
|---|---|---|---|---|
| FY2025 actual EBITDA before special items | €544m | 14.5% | 14.15x | Derived from primary evidence |
| Early-auction adjusted EBITDA | €712m | 19.0% | 10.81x | Secondary report |
| Signing-period approximate EBITDA | €800m | 21.4% | 9.63x | Secondary report |
| Final lender PF adjusted EBITDA | €880m | 23.5% | 8.75x | Secondary report; lender-marketed, not QoE-verified |
The €336 million gap between €544 million and €880 million is the central unresolved variable. The public evidence identifies possible mechanisms—plant ramp, capacity, mix, workflow integration, and standalone transformation—but validates none of the uplift numerically. The public-evidence decision EBITDA therefore remains €544 million.
Public comparable EV/revenue analysis is corroboration, not a point fair value. Peer mix, margins, geography, capital intensity, pensions, leases, and transaction-affected prices prevent a mechanical average.
| Public-comparable measure | Result | Interpretation |
|---|---|---|
| Clean-peer low | 0.96x | Kansai Paint |
| Clean-peer median | 1.91x | Nippon Paint |
| Clean-peer high | 2.03x | PPG |
| Median-implied target EV | €7.15bn | Observed EV is 7.7% higher |
| High-implied target EV | €7.61bn | Observed EV is 1.2% higher |
Axalta and AkzoNobel remain visible in the model but are excluded from clean headline statistics because their market prices were transaction-affected. Sherwin-Williams is a premium reference because architectural and retail coatings materially influence its valuation.
| Five-year sensitivity | Downside | Base | Lender / upside | Status |
|---|---|---|---|---|
| Entry EBITDA | €544m | €712m | €880m | Derived / Secondary report |
| Exit EV / EBITDA | 8.00x | 8.75x | 9.50x | Assumption |
| Sponsor/QIA gross IRR | (100.0%) | ~0.0% | 14.0% | Assumption/model output |
| BASF rollover gross IRR | (100.0%) | 4.2% | 18.8% | Assumption/model output |
| Ending net leverage | 8.77x | 3.81x | 2.01x | Assumption/model output |
These outputs are scenario sensitivities, not disclosed sponsor returns. Actual sponsor capitalization, interim distributions, management equity, tax structure, lender add-backs, and exit mechanics remain undisclosed. A one-turn change in the base exit multiple changes enterprise value by approximately €806.5 million.
Lens 3 — Debt Capacity, Interest Coverage, Liquidity and Downside
The public financing reconstruction combines secondary lender-market reporting, official note-admission notices, and an official Bank of China release. It identifies approximately €4.508 billion of term loans and secured notes, but not an RCF or complete credit agreement.
| Instrument | EUR equivalent | Pricing evidence | Maturity | Evidence status |
|---|---|---|---|---|
| EUR term loan B | €1,000m | Euribor + 375 bps; 99.5 OID | 7 years / 2033 | Secondary report |
| USD term loan B | €1,020m | SOFR + 350 bps; 99.5 OID | 7 years / 2033 | Secondary report and Derived FX |
| EUR secured notes | €1,250m | 6.500% | 2033 | Reported in official admission notice |
| USD secured notes | €638m | 7.125% | 2033 | Reported principal; Derived FX |
| RMB term loan B | €600m | Assumed 4.0% all-in | Undisclosed | Existence Reported by Bank of China; amount Secondary report |
| Identified financing | €4,508m | Weighted opening cash-rate proxy 6.28% | Derived from mixed evidence |
The opening annual cash-interest proxy is approximately €283 million before hedging, fees, amortization, or RCF drawings. A 100 basis-point shock on approximately €2.62 billion of identified floating-rate debt adds approximately €26.2 million of annual interest.
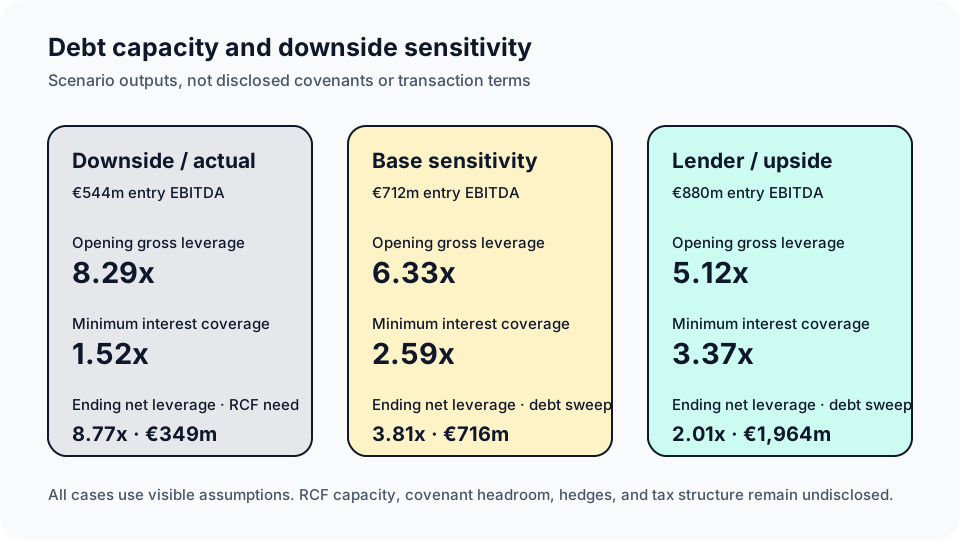
Credit sensitivity. All three columns are Assumption/model outputs using the reported or secondary EBITDA definitions and the Derived financing reconstruction; they are not covenant calculations.
| Credit output | Downside / actual earnings | Base | Lender / upside | Status |
|---|---|---|---|---|
| Opening gross leverage | 8.29x | 6.33x | 5.12x | Derived / Assumption |
| Year-one cash interest | €308m | €282m | €269m | Assumption/model output |
| Year-one EBITDA / cash interest | 1.73x | 2.59x | 3.37x | Assumption/model output |
| Minimum EBITDA / cash interest | 1.52x | 2.59x | 3.37x | Assumption/model output |
| Cumulative optional debt sweep | €0m | €716m | €1,964m | Assumption/model output |
| Ending net leverage | 8.77x | 3.81x | 2.01x | Assumption/model output |
| Cumulative analytical RCF need | €349m | €0m | €0m | Assumption/model output |
| Translation unit | Impact | Analytical use |
|---|---|---|
| 100 bps EBITDA-margin change | €37.5m annual EBITDA | Quality, pricing, mix or productivity |
| +10 days receivables | €102.6m cash pressure | Collections and customer terms |
| +10 days inventory | €52.4m cash pressure | Qualification and supply disruption |
| -10 days payables | €52.4m cash pressure | Supplier terms after carve-out |
| Combined working-capital stress | €207.5m cash pressure | Severe liquidity test |
| +100 bps on identified floating debt | €26.2m annual interest | Rate and hedge test |
Credit conclusion: Debt capacity is conditional. The public model can quantify an approximately €349 million downside liquidity need, but cannot confirm that committed RCF capacity, covenant headroom, hedges, or tax structure are sufficient.
Lens 4 — Strategic and Execution Risks
The strategic thesis is plausible but weakly verified. Public evidence supports technical capabilities and execution mechanisms; the economics, concentration, and separation terms required for a high-confidence investment case remain private or undisclosed.
| Risk | Public signal | Missing decision evidence | Financial translation |
|---|---|---|---|
| EBITDA quality | €336m separates FY2025 actual EBITDA before special items from lender PF adjusted EBITDA | Non-duplicative, recurring and cash-converting uplift bridge | Entry multiple shifts from 14.15x to 8.75x |
| Customer concentration | Named relationships and more than 42,000 customers | Top-OEM, platform, geography, powertrain and margin concentration | Revenue and margin downside cannot be sized |
| Münster concentration | 23.4% of stated employees plus HQ, R&D, commercial and manufacturing functions | Product-site earnings, alternate capacity, BCP and recovery times | Correlated outage and transfer risk |
| Qualification and quality | Formal customer-line qualification and approvals | Warranty, rework, recall, color-mismatch, premium-freight and line-stop history | 100 bps margin equals €37.5m EBITDA |
| Raw materials | EU evidence identifies polysulfides as a critical aerospace-sealant input with two global suppliers and no available substitute | Product-level single-source map, inventory and alternates | Supply interruption and working-capital risk |
| TSA and systems | At least one inherited BASF-hosted workflow remained visible during transition | ERP, MES, QMS, LIMS, formulation, color and master-data ownership/readiness | Duplicate cost, migration failures and delayed exit |
| Automotive cycle | German passenger-car production weakened in early 2026 while EV growth changes product and regional mix | Surventis exposure by platform, geography and powertrain | Volume and mix sensitivity remain unsized |
| Liquidity and exit | Downside needs analytical RCF support; base exit value is multiple-sensitive | RCF access, covenants, exit buyer and distributions | €349m liquidity need; €806.5m per exit turn |
The European Commission's polysulfides remedy release supports a specific aerospace-sealant supply-chain risk: only two global suppliers, no available substitute, and costly, time-consuming switching and qualification. It does not support a claim that every Surventis product has the same exposure.
What Would Falsify the Positive Thesis?
| Positive proposition | Evidence that would weaken or contradict it |
|---|---|
| Recent plants create durable productivity and volume benefits | Low utilization, unstable yield, duplicated volume, delayed approvals, or capex above plan |
| Qualification and workflow integration support customer retention | Short requalification cycles, nonexclusive annual rebids, weak renewal, lost nominations, or low digital-platform use |
| The global network limits disruption risk | High-revenue products with no qualified alternate plant or only one approved supplier |
| The carve-out can exit BASF dependencies without material leakage | Persistent TSAs, failed data migration, duplicate functions, high separation capex, or service incidents |
| The debt structure is sustainable | Validated EBITDA remains near €544m, working capital absorbs cash, RCF capacity is below need, or covenants constrain access |
Carve-Out and Technical Execution Questions
The diligence questions below are retained because a generic finance model cannot answer them. They connect operating evidence to cash, margin, liquidity, and downside.
| Diligence question | Why it matters financially | Required evidence | Status |
|---|---|---|---|
| Which formulation, supplier, plant, or legal-entity changes trigger notification, line trials, or requalification? | Delays savings, traps inventory, and can interrupt revenue | Approval register, change-control rules, cycle times, and failed-transfer history | Undisclosed |
| Which products and approvals depend uniquely on Münster, and where is qualified alternate capacity? | Co-location creates correlated outage risk | Product-site map, BCP, utilities, recovery time, and alternate-site approvals | Undisclosed |
| What is the five-year cost of warranty, rework, recall, color mismatch, and OEM line-stop claims? | Low-frequency events can destroy margin, cash, and future nominations | Claims ledger, chargebacks, root causes, provisions, and insurance recoveries | Undisclosed |
| Which pigments, resins, additives, and aerospace inputs have only one qualified supplier or site? | Interruption can halt production and force safety-stock builds | BOM-level sourcing map, contracts, inventory, alternates, and qualification status | Undisclosed |
| What remains under BASF TSAs, and can product, master-data, quality, and manufacturing systems operate independently? | Delayed exit creates duplicate cost; premature exit risks batch, certificate, and customer failures | TSA catalogue, application ownership, reconciliations, service levels, and exit milestones | Undisclosed |
| How are customer, platform, geography, powertrain, and margin concentrations distributed? | Customer count alone does not establish diversification | Revenue, contribution margin, contract duration, nominations, and renewal history | Undisclosed |
Assumptions and Methodology
The analysis uses a primary-public-source-first hierarchy. Reported transaction values and audited financials form the anchor. Public comparables, a reverse LBO, debt-capacity analysis, asset and operating evidence, and implied-expectation tests provide independent challenges. Outputs are not mechanically averaged. Missing information remains missing or becomes an explicit scenario assumption.
| Assumption | Downside | Base | Lender / upside | Status and control |
|---|---|---|---|---|
| Revenue CAGR | (1.0%) | 2.0% | 4.0% | Assumption; not management guidance |
| Year-five EBITDA margin | 14.0% | 19.5% | 22.5% | Assumption; lender uplift unverified |
| Maintenance capex / sales | 4.5% | 4.0% | 3.5% | Assumption; maintenance/growth split undisclosed |
| Cash tax rate | 28.0% | 25.0% | 23.0% | Assumption; tax structure undisclosed |
| Post-mandatory FCF cash sweep | 50% | 75% | 100% | Assumption; not contractual |
| Floating-rate shock | +100 bps | 0 bps | -50 bps | Assumption; hedge schedule undisclosed |
| Five-year separation / TSA cash cost | €270m | €170m | €105m | Assumption; actual TSA schedule undisclosed |
| Exit EV / EBITDA | 8.00x | 8.75x | 9.50x | Assumption; no point fair-value claim |
Additional visible assumptions are a five-year holding period, 1.0% transaction fees, 1.5% financing fees excluding OID, a €352 million minimum-cash proxy, a 4.0% all-in RMB cash rate, working-capital-day scenarios, and 1.0% annual mandatory TLB amortization. None is presented as a reported transaction term.
| Calculation control | Result |
|---|---|
| Sources less uses | PASS: €0.0m |
| FY2025 EBITDA bridge | PASS: €544m |
| Material calculation tie-out | PASS: 18 / 18 |
| Debt roll-forward | PASS: immaterial floating-point residue |
| Validated public lender uplift | OPEN: €0m validated |
| Downside liquidity | ALERT: €349m analytical RCF need |
| Unsupported critical claims | PASS: 0 |
Source Register
Material claims are linked where they appear above. This register identifies the main public authorities and secondary financing reports used in the page; private support material and internal QA are excluded.
| ID | Source | Evidence class | Use on this page |
|---|---|---|---|
| BASF-01 | BASF closing announcement, 1 Jul 2026 | Reported / primary company source | Close, €7.7bn EV, €5.8bn proceeds, 40% retention, perimeter |
| BASF-02 | BASF Report 2025: acquisitions and divestitures | Reported / audited | FY2025 sales, EBIT, cash flow, working-capital inputs |
| BASF-03 | BASF Half-Year Financial Report 2026 | Reported / primary filing | Consideration, retained-interest fair value, accounting bridge |
| BASF-05 | BASF decorative-paints closing release | Reported / primary company source | Perimeter reconciliation |
| BASF-06 | LCD/PitchBook syndication report | Secondary report | Final TLB terms, leverage reporting, €880m lender PF EBITDA |
| BASF-07 | TISE secured-notes admission | Reported / official market notice | Secured-note principal, coupon, and maturity |
| BASF-08 | Bank of China syndicated-loan release | Reported / primary lender source | Cross-border facility and currencies; not tranche amount |
| BASF-09 | Octus auction-financing report | Secondary report | €712m process-stage adjusted EBITDA |
| BASF-10 | Bloomberg Law signing-financing report | Secondary report | €800m signing-period approximate EBITDA |
| BASF-12 | BASF Report 2025: segment and regional reporting | Reported / audited | Depreciation, amortization, impairments, and additions |
| BASF-13 | BASF Report 2025: steering concept | Reported / primary company source | Derived €544m Coatings EBITDA before special items |
| SURV-01 | Surventis launch release | Reported / primary company source | Current scale, workforce, customers, sites, and portfolio |
| SURV-02 | Surventis Münster site profile | Reported / primary company source | Münster functions and workforce |
| SURV-03 | BASF Münster high-runner plant release | Reported / primary company source | Recent capacity and automation mechanism |
| SURV-04 | BASF Caojing capacity release | Reported / primary company source | Resin capacity increase |
| SURV-09 | Surventis Airbus SQIP release | Reported / primary company source | Qualification and delivery mechanism |
| SURV-11 | BASF Xiaomi full-layer coatings release | Reported / primary company source | Full-layer integration and development relationship |
| SURV-14 | Surventis aerospace approvals profile | Reported / primary company source | Approval burden and technical scope |
| SURV-15 | European Commission polysulfides remedy release | Reported / regulator | Specific critical-input and qualification risk |
| VDA-01 | VDA German production release | Reported / industry body | Automotive-cycle context |
| VDA-02 | VDA May 2026 production release | Reported / industry body | Current-cycle downside signal |
Independent-Analysis Disclaimer
This Field Note is independent public-information analysis. EOJI is not affiliated with BASF, Surventis, Carlyle, QIA, their lenders, or their advisers, and was not engaged by a transaction party. It does not represent Carlyle's confidential investment case, a lender credit agreement, a closing funds-flow statement, a fairness opinion, or investment-decision-ready underwriting.
It does not constitute investment, credit, legal, regulatory, tax, accounting, financing, brokerage, or risk-management advice. It is not an offer, securities recommendation, financing recommendation, rating action, lending decision, transaction recommendation, or statement of confidential transaction economics. Company names and trademarks belong to their respective owners. Information is subject to correction as new public evidence becomes available.
Discuss a source-linked transaction analysis workflow
EOJI structures public evidence, valuation assumptions, downside cases, and diligence questions into reviewable transaction work.
Discuss a transaction workflow